The 4 Analytics Questions of Subscription Ecommerce
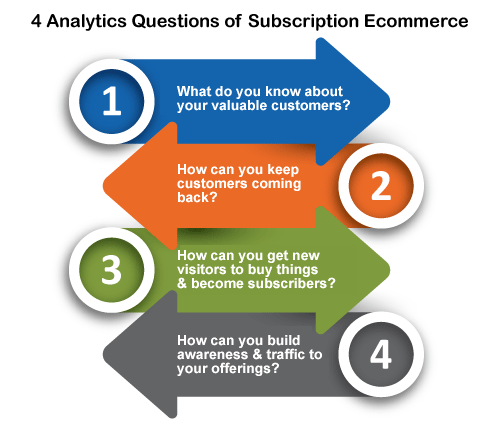
I have spent over 20 years building my own subscription based service (SportsCollectors.Net) and working for companies with subscription offerings (Dell, Jupiterimages, Weight Watchers, Rent the Runway, ElysiumHelath). While the business models, value propositions and customer segments of these companies may be very different, there are similarities I recognized as these companies (all with product market fit) looked to accelerate their growth. From this, the 4 questions above are what analytics teams should spend resources trying to answer.
Please Note:
The order of these questions is in the context that you have an existing subscription based offering (with existing data available to analyze) you want to optimize+grow. If you are starting a new subscription offering/company, the order would likely be the opposite.
So let's dig into each one of these topics:
1) What do you know about your valuable customers?
You are likely in business to serve your customers' needs and/or deliver some value that they are comfortable (or even happy) to pay you for. It helps to understand who are those customers that are most happy and making you money. These folks tend to be your biggest ambassadors (promoters) and support your growth the most.
Margin as a measure of value
I've seen different definitions of "Lifetime Value", many revolving around top line revenue. I personally like to start with looking at the amount and the details that make up the total margin a specific user represents to the business. So I start by building a ledger for each user showing the credits (increases to equity account) and debits (decreases to equity account).
Let's look at a very simple ledger for a subscription for a content site:
| Date | Debit (money out) | Credit (money in) | Margin | ||||
| 12/03/2018 | Google AdWords CAC (campaign 892) | $2.00 | -$2.00 | ||||
| 01/01/2019 | Subscription (order 1987) | $9.99 | $7.99 | ||||
| 01/01/2019 | Subscription promo (order 1987) | $9.00 | -$1.01 | ||||
| 01/03/2019 | Monthly operations cost | $0.14 | -$1.15 | ||||
| 01/03/2019 | Monthly affiliate revenue | $0.37 | -$0.78 | ||||
| 02/01/2019 | Subscription Renewal - Term 2 | $9.99 | $9.21 | ||||
| 02/03/2019 | Monthly operations cost | $0.14 | $9.07 | ||||
| 02/03/2019 | Monthly affiliate revenue | $1.28 | $10.35 | ||||
| 03/01/2019 | Subscription Renewal - Term 3 | $9.99 | $20.34 | ||||
| 03/02/2019 | Pay Per View Event (order 2508) | $3.99 | $24.33 | ||||
| 03/02/2019 | Royalty for Pay Per View Event | $1.00 | $23.33 | ||||
| 03/03/2019 | Monthly operations cost | $0.15 | $23.18 | ||||
| 03/03/2019 | Monthly affiliate revenue | $2.31 | $25.49 | ||||
| 03/15/2019 | Mid-term cancel - partial refund | $5.00 | $20.49 | ||||
| Totals | $17.43 | $37.92 | $20.49 | ||||
There's some interesting questions looking at this kind of data can unearth:
- How does this user's journal entries compare to others?
- Was their desirable ROI on the $2.00 AdWords attribution?
- Was offering a $9.00 signup promo worthwhile (we won't see margin on user until second month)?
- Since this user's affiliate revenue is increasing and they bought a Pay Per View Event, should we incentivize renewal?
What do your users tell you?
- WeightWatchers has a goal of helping members get healthier - so it may ask about current weight, weight loss goals, lifestyle or dietary preferences, age, location.
- Rent the Runway has a goal of helping members enjoy fashion options - so it may ask about body type, height, birthdate, location, style preferences.
- EHarmony has the goal of matching users for relationships - so it has users spend 45 minutes to fill a lengthy questionnaire about their lifestyles and personal preferences.
- SportsCollectors.net has the goal of helping members enjoy collecting sports autographs - so it may ask about want lists, favorite players/teams, what items they have for trade/sale, their ebay username, year of birth, location.
Do your users' actions tell you things?
In addition to the margin profile, I have also invested time in building a user journey (now being marketed as the Activity Schema) - which is a time series of all the actions and communications with this subscriber. A user journey can be represented with the following data elements:
| UserID | Timestamp | User_Event | Payload |
| 12345 | 01/01/2019 00:00:00 | PAGE_LOAD | {"device_type": "desktop", "marketing_channel": "google_sem", "url": "http://www.hello.com/about-us/?utm=sem_plan1"} |
| 12345 | 01/01/2019 00:01:00 | PAGE_LOAD | {"device_type": "desktop", "url": "http://www.hello.com/plans"} |
| 12345 | 01/01/2019 00:02:00 | PAGE_LOAD | {"device_type": "desktop", "url": "http://www.hello.com/register"} |
| 12345 | 01/01/2019 00:03:00 | PAGE_LOAD | {"device_type": "desktop", "url": "http://www.hello.com/login"} |
| 12345 | 01/01/2019 00:04:00 | PAGE_LOAD | {"device_type": "desktop", "url": "http://www.hello.com/subscribe"} |
| 12345 | 01/01/2019 00:04:00 | PLACE_ORDER | {"order_id": 1987, "order_status": "payment_received", "order_type": "SUBSCRIPTION", "amount": "0.99"} |
| 12345 | 01/01/2019 00:07:00 | RECEIVE_EMAIL | {"template": "201900101_new_years_cohort", "list_name": "hello subscribers"} |
| 12345 | 01/01/2019 00:015:00 | OPEN_EMAIL | {"template": "201900101_new_years_cohort", "list_name": "hello subscribers"} |
| 12345 | 01/01/2019 00:16:00 | PAGE_LOAD | {"device_type": "mobile", "url": "http://www.hello.com/article/hot-investments"} |
| 12345 | 01/01/2019 00:21:00 | PAGE_LOAD | {"device_type": "mobile", "url": "http://www.hello.com/article/trending-for-2019"} |
This structure allows us to define multiple types of events across our system and the relevant details about each as JSON in the "Payload" field.
In order to achieve this, we need to have the ability to track what different users are doing in our system. We have a service that we call to log our users' actions to get the PAGE_LOAD events (there are services like snowplow, segment or google analytics for this), we get the PLACE_ORDER events from the order table in our database, and we get EMAIL related information from our email vendor (mailchimp, sailthru, cheetahmail do this kind of thing).
This very simple example shows that User 12345 has 10 events associated with them:
- He arrives to the site from a google paid search. We can use this to attribute our marketing acquisition cost.
- He views our plans page, then registers for an account, then logs in, and then places an order all on a desktop browser. Seeing the steps taken before an order is placed allows us understand our conversion funnel.
- Our system sends email (through an email vendor) and can track if it is opened or clicked on.
- He reads 2 article pages on their mobile device.
Margin + Profile Info + Actions == Potential for Analysis
When we combine the margin of a user, their profile information, and the actions in their user journey, we can:
- Find who are the high margin users and what makes them so. Develop understanding what actions and features drive higher margins.
- Find out what our members like and want. Develop understanding of their interests across segments of our membership. Understand how should we communicate with them - (effectiveness of email, chat, customer service, retail channels).
- Develop features/content (and possibly create experiments) to further satisfy the user. This can help support goals for longer retention or converting on up-sell opportunities.
- Find out how to describe and categorize our users. Does their profile and actions allow us to classify them into naturally forming groups?
- Try to make our offerings more attractive to future users. What are common paths for conversion and what types of folks convert quickly, slowly, not at all. Where do users get stuck and what actions have worked to de-risk these scenarios.
- Find out how our users at different margin levels find us. This can help optimize our marketing/awareness efforts.
- Understand what happens when we make changes to the offering - such as changing features, content, messaging, pricing, support options, etc.?
2) How can you keep customers coming back?
- Assuming that your offering can be profitable (subscription fees are higher than your costs), your revenues and margins scale linearly to the number of subscription terms that users pay for. So figuring out how to maximize retention will increase your earnings.
- It is almost always cheaper to retain current customers than to acquire new ones.

Measuring retention?
Visualizing retention rates by cohorts
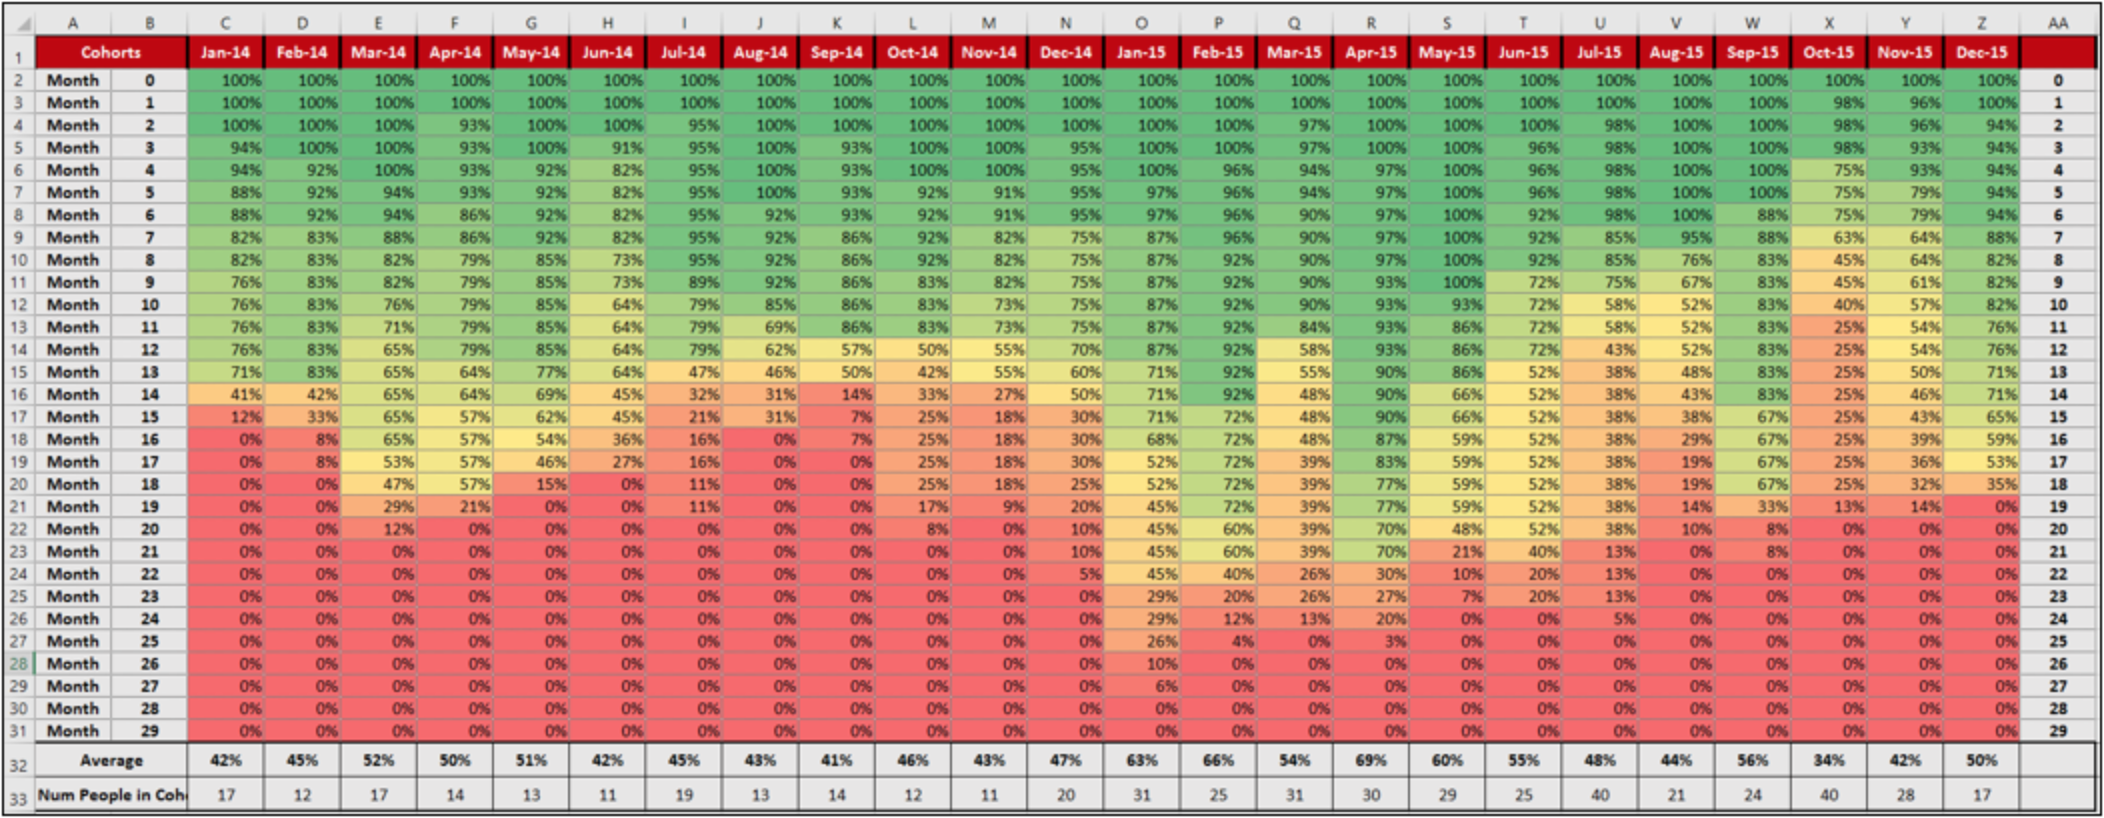
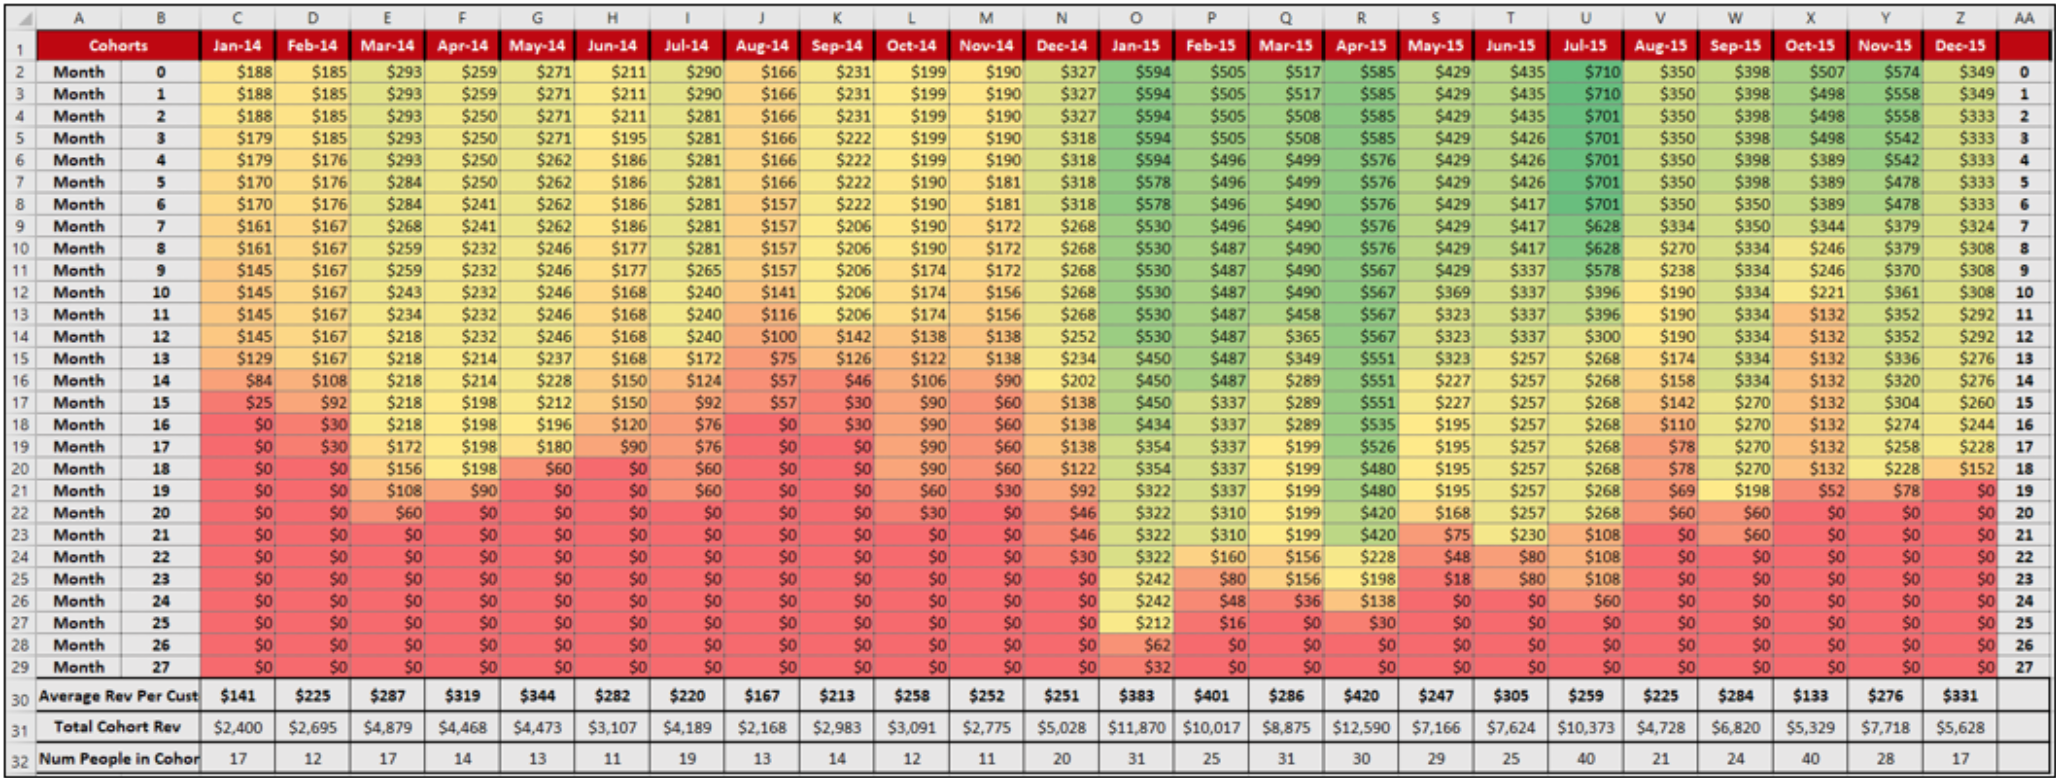
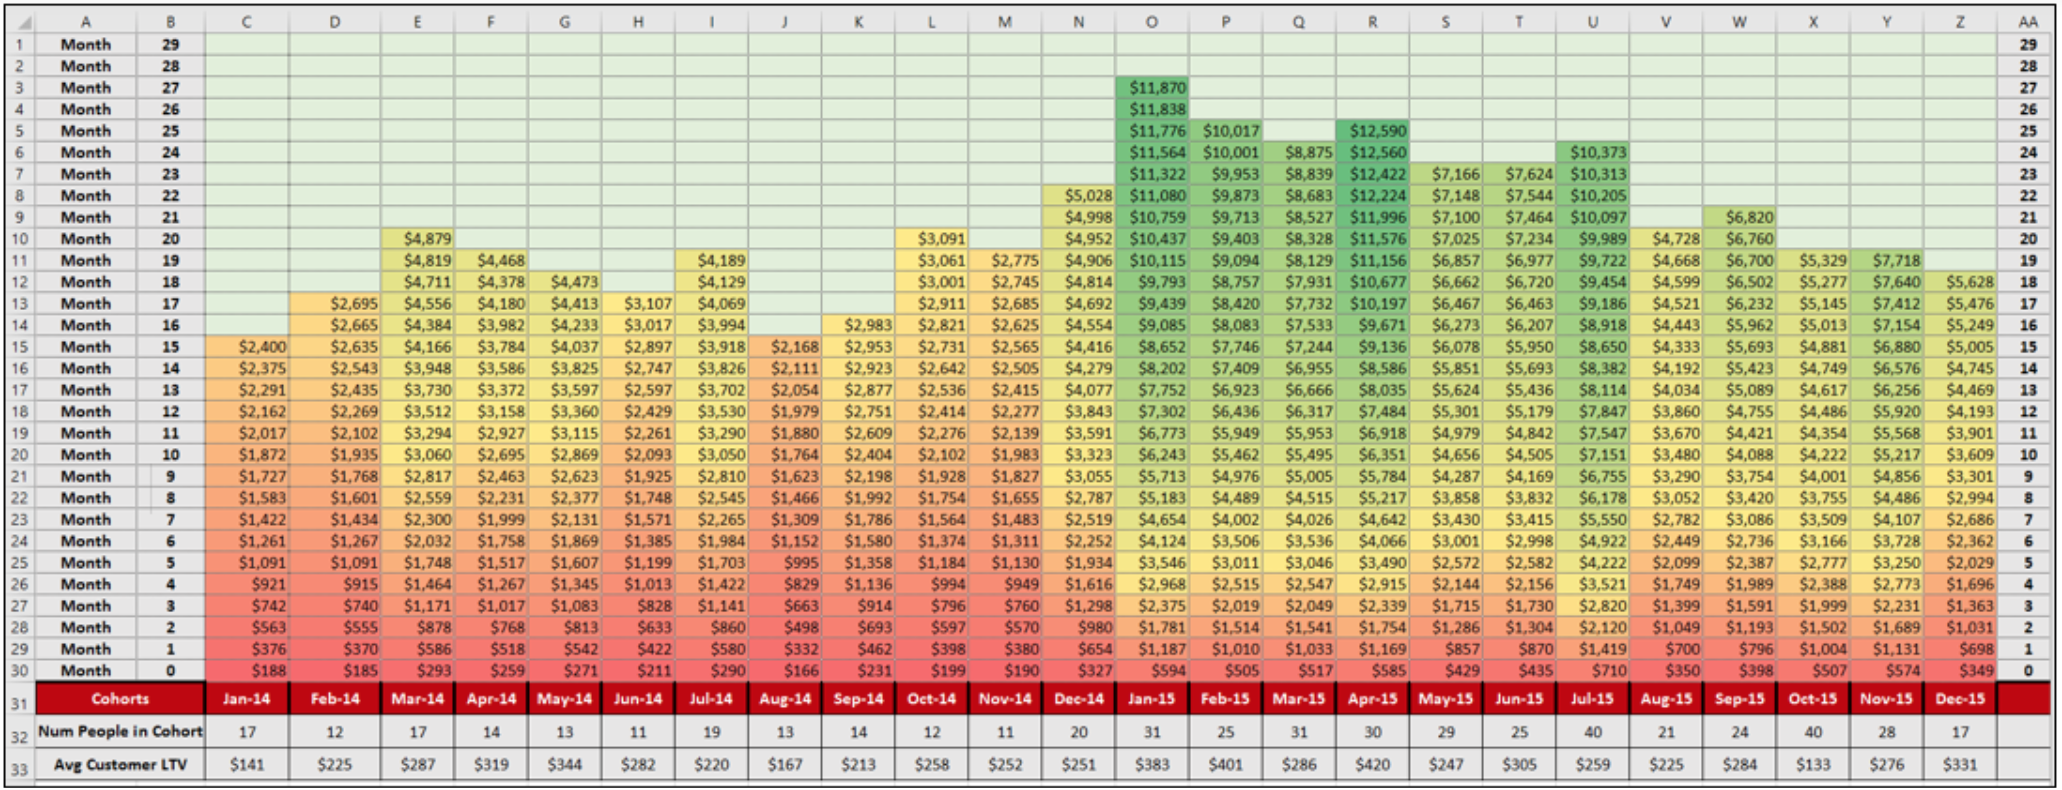
The most common way people seems to look at retention rate is to segment into related groups - known as cohorts. Each person in a cohort must share a related yet distinguishable trait that separates them from the other cohorts. In these examples, our cohorts will be based on the month that users starts their subscriptions.
Aaron Chantiles has done a nice job creating these 3 cohort model reports:
1) Survival Analysis - for each month term we can see the percentage of the original users in that cohort that are still active.
2) Average Revenue per User - for each month term we can see the average revenue of the active users in that cohort. (this could be margin instead)
Note: Big variances from month to month likely results from introducing major changes to your subscription plan, adding some great new features, breaking something, or big impact from seasonality.
3) Total Revenue by Cohort - for each month term we can see the total cumulative revenue of the active users in that cohort. (this could be margin instead)
Understanding and Predicting user retention
KEY QUESTION - If we can somehow experience or 'learn' how users have behaved in the past (those who churned and those who stayed), then can we can predict how your current users will behave in the future?
We can try to leverage our user profile information, ledger, and user journey data sets to discover things about our users and how they behaved. We'll start by defining some variables (features) that we think may contribute to retention for a subscription content site:
| metric | type | source | description |
| median_income | int | profile | we can join user's location on census data |
| population_density | int | profile | we can join location on census data |
| user_age | int | profile | age in full years |
| first_month_price | int | ledger | amount of first month cost (to determine impact of promos) |
| customer_acquisition_cost | int | ledger | amount of acquisition cost (to determine impact of paid marketing sources vs. organic) |
| total_margin | int | ledger | total margin the user has contributed to the company |
| searches_count | int | journey | the number of searches they performed |
| visit_count | int | journey | the number of times they visit |
| articles_per_visit | decimal | journey | the number of articles they view per visit |
| views_per_article | decimal | journey | average number of times they visit the same article |
| favorite_count | int | journey | number of times they favorite content |
| recommendation_count | int | journey | number of times they recommend/share content |
| non_subscription_revenue | decimal | ledger | amount of non-subscription revenue |
| term_number | int | journey | number of terms |
| is_churn_next_term | boolean | journey | did the user churn in the next term |
Once we build a nice data set, we can do some data exploration.
- We can run queries on the top 50-100 highest margin users and see visually view if there obvious patterns that can guide deeper exploration.
- If we see that these folks read lots of content, come in with low customer_acquisition_cost, and/or produce more non-subscription revenue - then we can dig on specifics of the behaviors related users achieving those actions/milestones.
We can plot each of the metrics against number of terms and see which ones correlate well.
In the past I have built machine learning models to try to identify what variables drive retention and show us the probability that a user is going to churn from their membership in upcoming terms (a.k.a . Churn model). As you can probably imagine, there is a substantial amount of data engineering work (data capture, feature definition, cleanup/transformation/standardization/regularization/labeling, validation) needed and lots of data exploration before we consider running models.
I may devote a full future blog post to this, but for now I'll share some outside blog posts with helpful approaches along with python examples how to do this.
My preference is try to calculate a Subscriber Fragility Score that indicates the likeliness that a subscriber with churn in the upcoming billing term. Many folks use regression and classification models to do this:
- https://towardsdatascience.com/predict-customer-churn-in-python-e8cd6d3aaa7
- https://365datascience.com/tutorials/python-tutorials/how-to-build-a-customer-churn-prediction-model-in-python/
- https://neptune.ai/blog/how-to-implement-customer-churn-prediction
- https://square.github.io/pysurvival/tutorials/churn.html
- https://thedatascientist.com/customer-churn-machine-learning-data-science-survival-analysis/
3) How can you get new visitors to buy things and become customers?
This area is a huge focus in many companies and I know quite a few Product Managers who have over a decade each dedicated to working on incrementally improving buyer experiences and getting better conversion. In all those cases, they heavily rely on data (and analysts) to help guide their activites.
Let's start with some questions
1. What is the value proposition of the subscription product? What is the problem that we think it solves and for what groups of people?
There are many approaches and tools analysts can use to define a product's value proposition to users.
Peter Thompson introduces a diagram view that he calls the Value Proposition Canvas. He defines as:
A value proposition is the place where your company’s product intersects with your customer’s desires. It’s the magic fit between what you make and why people buy it. Your value proposition is the crunch point between business strategy and brand strategy.
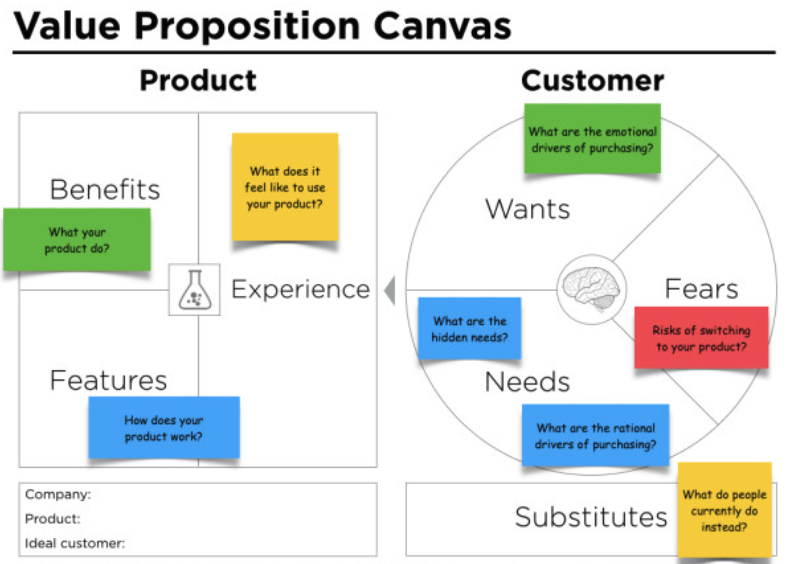
Below is an example illustration for an angel investing syndicate with a co-working space for the member investors and their portfolio of startups.

I'd want to try to quantify the key elements of the value proposition, specifically from the buyer's perspective (wants, needs, fears and substitutes). We can try to collect factual information, statistics, or research results from credible external sources that support the value proposition. This could include industry expert opinions, awards, or mentions, as well as documented improvements or reductions in attributes like revenue or costs.
2. How can a user purchase a subscription? More specifically what is the process users generally take to make purchases and what is the messaging about the product?
A subscription funnel is an analytical method used to analyze the sequence of events in a subscription-based offering. Funnel analysis tracks user behavior throughout their user journey and calculates how many people make it through each step, allowing marketers / product managers to optimize their strategies and improve user experiences, hopefully leading to subscription growth.
Typical steps in a subscription funnel for a website can be broken down into the following stages:
- Awareness: The user becomes aware of the website or service. This can include visiting the website, receiving an email, receiving a referral or seeing an advertisement.
- Interest: The user shows interest in the service by signing up for a newsletter, registering for a free trial, or subscribing to receive updates.
- Evaluation: The user evaluates the service by exploring features, reading reviews, or comparing it with competitors.
- Conversion: The user decides to subscribe or purchase the service.
- Checkout: The process and/or steps a user takes to subscribe to the service and make payment.
Being able to leverage each action and signal in the user journey (time series of events) discussed earlier provides an opportunity to understand the funnel for each user and across user groups. Below is a basic example of funnel visualization on a companies's checkout process that shows the drop off from each step:
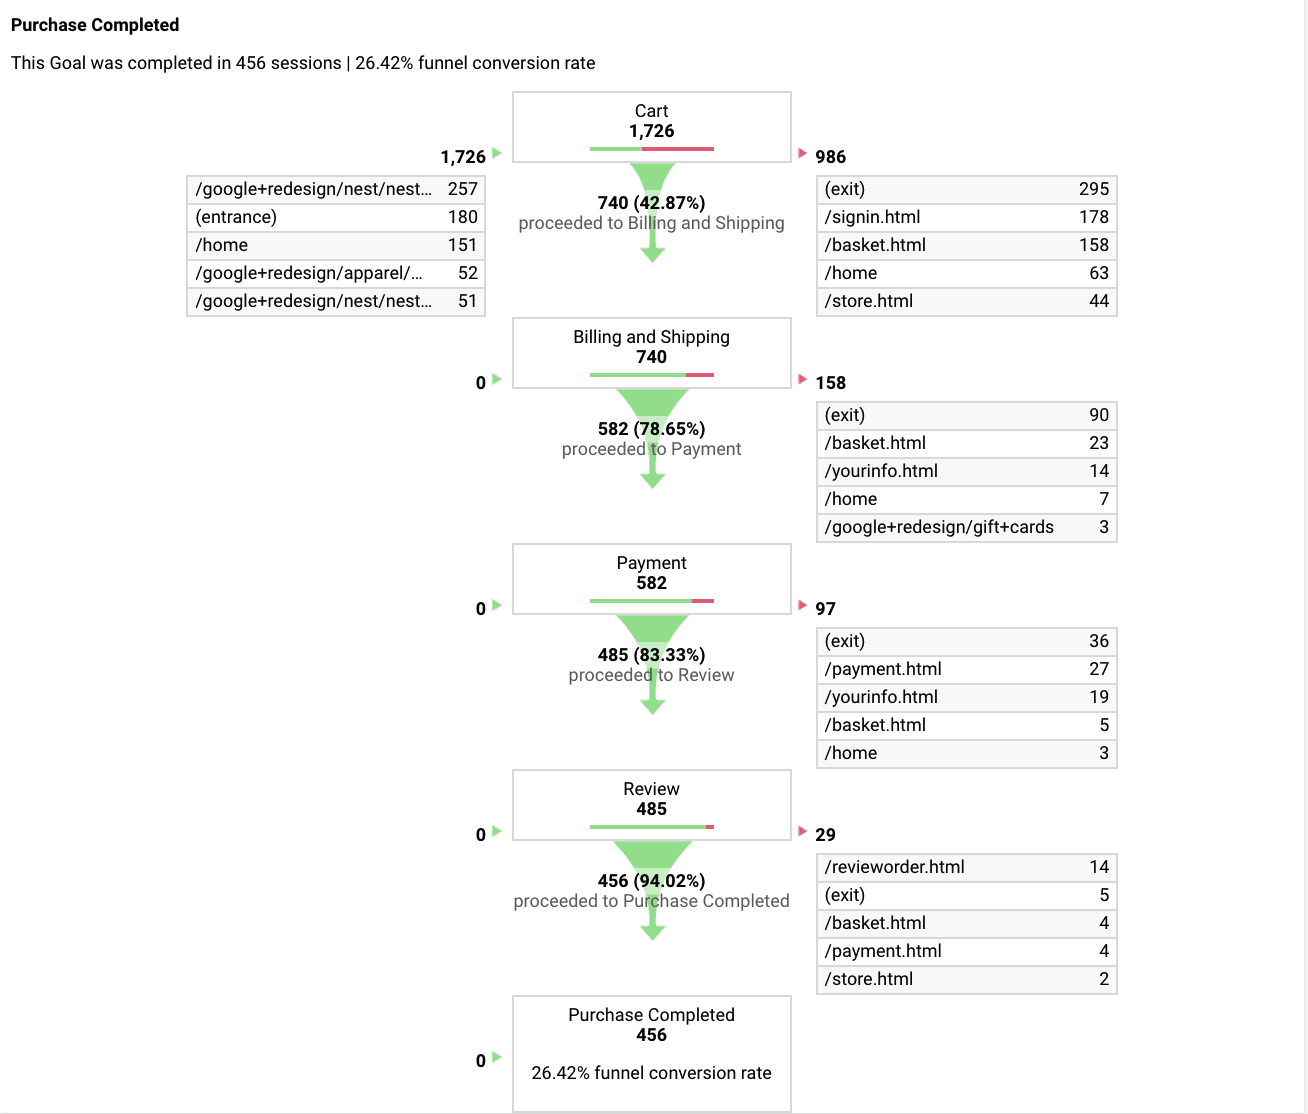
We could next take it further in a BI tool or App (streamlit, Dash, Shiny, etc) we add support for filtering based on user attributes such as demographics, referral method (ads, organic), user behaviors, timing, etc.
3. What do you we know about the people who become subscribers? Are there consistent differences from the visitors to your site that do not become subscribers?
When analyzing users who convert and users who don't for a subscription product, there are several data elements that can be useful for an analyst / data scientist:
- User demographics: Age, gender, location, and other demographic information can provide insights into the types of users who are more likely to convert. Analyzing these factors can help identify target segments for marketing and user acquisition efforts.
- User behavior: Tracking user interactions with the product (via our user journey), such as features used, frequency of use, and duration of sessions, can help identify patterns and trends among converting users. This information can be used to optimize the user experience and improve conversion rates.
- Conversion funnel analysis: Analyzing the steps users take before converting can reveal potential bottlenecks or barriers to conversion. Identifying these issues can help optimize the conversion process and increase overall conversion rates.
- User feedback: Collecting and analyzing user feedback, such as ratings, reviews, and survey responses, can provide valuable insights into user preferences, pain points, and areas for improvement. This information can be used to refine the product and marketing strategies to better cater to user needs.
- Marketing and promotional efforts: Analyzing the effectiveness of marketing campaigns and promotional efforts can help identify which channels, messages, and targeting strategies are most successful in driving conversions. This information can be used to optimize marketing budgets and improve overall conversion rates.
- Customer lifetime value (CLV): Assessing the long-term value of customers can help determine which user segments are most profitable and inform decisions regarding customer acquisition, retention, and marketing strategies.
You can likely do some quick exploration to see how much each of these metrics/areas correlate to subscription over different timeframes or cohorts.
What can you try to learn more?
Ask users what they want and why they aren't buying
You can ask them (maybe even offer some kind of bribe) to understand specifically what their needs/wants are and why do not think the value proposition of your offering will satisfy them at an acceptable cost.
I would want to find out if they think:
- Do they actually think they need your product?
- Are your prices too high?
- Is there a competitor with a better suited offering or better distribution?
- Are their friends using your product and giving positive feedback about it?
Look at the Churn Model.
I have found that it is often the case that the reasons why subscribers churn is also the reasons why users are hesitant to subscribe to your product. You may find overlap from an asset you already have.
Test Things and Run Experiments
You can conduct experiments to test different versions of your website or app to identify the most effective design, content, messaging, or features that drive customer engagement and conversion. You can use statistical hypothesis testing to determine the impact of each variation on customer behavior.
- Promotions: Impact from offering a trial or promotion (discount) for new subscriptions.
- Pricing: Impact from offering different pricing options or the impact of different display variations of the pricing options.
- Funnel / Checkout: Impact from changing the steps in your checkout process.
- Messaging: The way you message about your product's benefits (on site, partner sites, email, physical collateral, etc.).
- Channels: Impact from the places your product is promoted and referred from.
Customer Segmentation, Targeting and Personalization
You can analyze customer data to identify different segments and their behavior patterns. This will help you understand which customers are more likely to make a purchase or subscribe to your services. You can use clustering algorithms like K-means or DBSCAN to group customers based on their characteristics, such as demographics, purchase history, and browsing behavior.
4) How can you build awareness/traffic to your offerings?
I do not claim to be a growth marketing expert, but I have worked with some very smart folks in this domain area and have learned some things along the way.
Marketing Channels
Here are some of the tactics I have seen used to varying degrees of effectiveness to build awareness and traffic to your subscription offerings as a growth marketer:
Leverage social media platforms
Facebook, Instagram, YouTube, Twitter, TikTok, LinkedIn and others have HUGE highly active audiences. They can be fantastic avenues for attracting potential customers.
Much of the volume is done as part of running brand-awareness (paid) ads that target specific audiences based on behaviors and preferences. This can help improve reach and recall, and even create 'lookalike' audiences similar to your existing followers. These platforms offer many different ad formats and creative display options that can appeal to your potential audience.
In addition to paid options, many of the social networks provide opportunities to promote your offerings (just be careful not to be too spammy or obnoxious about promoting your business). Facebook and LinkedIN groups are often dedicated to specific niche topics and may be a good avenue to find users.
Example - I am part of many Facebook groups related to sports autograph collecting, so I often answer questions letting newer collectors know they can find information they seek on SportsCollectors.Net.
Organize contests and giveaways
Host simple content or giveaways to grow your following and drive brand awareness.
Example - Tech Influencer Alex Xu gives away his popular book "System Design Interview" in order to promote his excellent ByteByteGo paid newsletter.
Give something away for free
Offer a free trial or free samples of your subscription service or product to give potential customers a taste of what you offer.
Example - I signed up for a free one month trial for Github's Copilot service that offers suggestions as I write code.
Content marketing
Publish blog posts, articles, or other forms of content to establish your expertise and thought leadership in your industry. This can help build brand awareness and drive traffic to your website.
Example - Sports Card Investor hosts regular podcasts talking about the latest high level market trends and features in their MarketMovers subscription product for sports card sales data and analytics.
Influencer marketing
Collaborate with influencers and brand ambassadors to promote your subscription offerings and reach a wider audience.
Example - This youtube video from Mr. Beast, which has 1M+ views — it’s engaging and encourages the audience to give Honey a try. Companies such LTK can even help you find influencers that would work for your company.
Email marketing
Use email marketing to engage with your audience and promote your subscription offerings.
Example - While I was at ElysiumHealth, their quarterly newsletters (the Abstract) were packed with deep scientific dives on longevity topics related that drove interest to their core products.
Employee advocacy
Encourage your employees to share your brand and subscription offerings on their social media platforms. Create a culture where employees proactively want to evangelize your organization.
Example - I saw that many of the employees at Rent the Runway across business different functions in the company would publicly suggest the company's subscription offerings as well as specific rental products.
Events
Hosting Physical events to introduce your product to new audiences.
Example - Amazon hosts events at their AWS Startup Lofts where experienced AWS architects can help you design solutions to solve your technical problems using AWS products.
Search Engine Optimization (SEO)
Marketing technique that is focused on bringing organic, non-paid traffic to your website by using high quality content to get to the top of a search engine results page.
We want to analyze what works (and doesn't)
We will want a way to understand the impacts of traffic and conversion/sales from each of the marketing channels your company employs.
Common Problem - Disparate reporting does not reconcile
I have found that many marketers (potentially in different marketing functions) generally use SaaS products for their specific channels that each allow you to set up tagging on your site to track activities within their application.
- Your email service provider (like MailChimp, Iterable, Klaviyo, etc) may attribute the full value of customer purchase if the user has opened an email sent from their platform.
- Facebook and Google may attribute the full value of that same customer purchase if users were sent to your site from paid ads you bought on their systems.
- Your influencer or referral partners (like Yopto, Talkable, Mention Me, etc) may also attribute the full value of that same customer purchase if users were sent to your site from referral links from their systems.
So what generally happens is that the leads for email, paid, and influencer marketing download the performance reports from their respective SaaS system and present an overstated ROI for their area. You won't have a clear picture of how well each channel is contributing and how to prioritize spend between. This invariably leads to questions from your finance team when budgets are being planned out and the numbers don't all add up.
How Rules Based Attribution Models Work
Rules Based (non-model driven) marketing attribution models assign credit to specific marketing channels or touch points based on predetermined rules or assumptions, rather than analyzing data and customer behavior patterns to determine attribution.
These models are popular because they are easy to understand, relatively straight forward to implement and can provide directional signal around ROI. They can be a good choice for businesses that are just starting out, have limited resources or have less a complex/diverse marketing channel mix. I have personally seen most companies implement these kinds of models.
There are several types of rules based attribution models that businesses can use. These include:

Our user journey data contains the full set of actions associated with each user that we are able to track from internal and partner systems. It is industry standard that we set up UTM parameters on incoming links that will inform us of the source, medium, and campaign associated with that user's visit. We will store those parameters as part of payload for each relevant event that we can later use for analysis.
We will want to use user journey to be able to track individual customer interactions with our brand. The closest method we have to do this is with sessions, defined as discrete periods of activity by a user. The industry standard is to define a session as a series of activities followed by a 30 minutes window without activity. So we can write some code to categorize the actions in our user journey into sessions, with the first action representing channel information we will use for attribution of that session. We can use all of the sessions before a conversion as part of our attribution calculation.
Based on the preferred attribution methodology shown in the diagram above, we can divide up the sessions for each transaction and attribute the revenue (and return on associated marketing spend) accordingly.
Claire Carroll wrote a helpful blog post detailing an example of how to model out user journey data into sessions with only SQL using the dbt framework. It is very similar to the methodology I have taken in the past do this.
My personal preference is to use either Time Decay or Position-Based models. I have found the most important thing is that you get consensus with the model that everyone will use up front, and then optimize around the related metrics.
Data Driven Attribution
Data-driven attribution gives credit for conversions based on how people engage with your various ads and decide to become your customers.
Unlike the previous discussed rules based models, data-driven attribution gives you more accurate results by analyzing all of the relevant data about the marketing moments that led up to a conversion. Google uses this data-driven attribution in Google Ads as the models takes multiple signals into account, including the ad format and the time between an ad interaction and the conversion. They can drive better conversions because their systems can better predict the incremental impact a specific ad will have on driving a conversion, and adjust bids accordingly to maximize your ROI.
There are two machine learning models that have become popular to use for data driven attribution:
1. Shapely Value
The Shapley value is a way to fairly distribute credit for a shared outcome among team members by applying an algorithm based on a concept from cooperative game theory called the Shapley Value. In the case of data driven attribution, marketing touchpoints are the "team members", and the "output" of the team is conversions. The algorithm computes the counterfactual gains of each marketing touchpoint, which means it compares the conversion probability of similar users who were exposed to these touchpoints to the probability when one of the touchpoints does not occur in the path. The actual calculation of conversion credit for each touchpoint depends on comparing all of the different permutations of touchpoints and normalizing across them.
James Kinney posted a nice explanation of how Game Theory and Shapely Value can be applied to Data Driven Marketing Attribution. He also provides a helpful Jupyter notebook with python code on his Github.
2. Markov Model
A Markov model is a type of probabilistic model that describes a sequence of events where the probability of each event depends only on the state of the previous event. In the context of marketing attribution, a Markov model can help us model user journeys and how each channel factors into users moving from one channel to another to eventually make a purchase.
For example, let's say a user first sees a Facebook ad, then clicks on a Google search result, and finally makes a purchase on your website. A Markov model would help us understand the probability of users moving from Facebook to Google and from Google to your website.
One advantage of using a Markov model for marketing attribution is that it can account for the structure of your data, which may lead to more accurate results. However, it is more complex than other attribution models, and may require the help of a data scientist to implement at scale.
To use a Markov model for marketing attribution, we need to estimate a transition matrix that describes the probability of moving from one channel to another. We can then compute the "removal effects" of each channel, which tells us the probability of conversion when a channel is removed from the user journey. This allows us to determine each channel's contribution to conversion and/or value.
James Kinney posted Cloudera uses Markov models to solve multi-channel attribution in his post Marketing Attribution with Markov.
Challenges with Attribution
- It requires set up and discipline to collect all of the necessary data in a central place (like a data warehouse). That means your team needs the data engineering skill sets to do the appropriate pipeline building, transformation and modeling.
- Your user journey may be missing some percentage of actions. Many have found it to be challenging to associate actions with anonymous (non signed in) users using mobile applications and mobile browsers.
- It is challenging to find a proxy for incorporating offline data, such as exposure to a TV, radio or print ad.
- Lack of visibility into external trends that might affect marketing efforts and conversions, such as seasonality, without incorporating aggregate information.
- Attribution models can be subject to correlation-based biases when analyzing the customer journey, causing it to look like one event cause another, when it may not have.
- Consumers who may have been in the market to buy the product and would have purchased it whether they had seen the ad or not. However, the ad gets the attribution for converting this user.
- Bias toward cheap Inventory gives an inaccurate view of how media is performing, making lower cost media appear to perform better due to the natural conversion rate for the targeted consumers, when the ads may not have played a role.
- Attribution models can often overlook the relationship between brand perception and consumer behavior, or will only look at them at a trend regression level.
- The quality of creative and messaging are just as important to consumers as the medium on which they see your ad. One common attribution mistake is evaluating creative in aggregate and determining that one message is ineffective, when in reality it would be effective for a smaller, more targeted audience. This emphasizes the importance of person-level analytics.
