Apache Superset Test Drive

I have lately been playing with some commercial BI & Dashboard tools. There is a certainly quite broad range when it comes to features, price, scalability, administration capabilities, how they can access data, and set up complexity. For a good sized enterprise (with 100+ users), some of these solutions can run you several hundred thousand dollars per year.
As part of my diligence, I felt like I need to look at the best of breed Open Source offering - Apache Superset created by AirBNB. So I went to https://superset.incubator.apache.org/ to check out the features and documentation. I was impressed, so I gave it a whirl.
Installation
They had some pretty simple instructions to get it running on Docker:
1
2
3
4
5
git clone https://github.com/apache/incubator-superset/
cd incubator-superset/contrib/docker
docker-compose run --rm superset ./docker-init.sh
# you can run this command everytime you need to start superset now:
docker-compose up
This created 3 docker images (superset, postgres to hold the configuration, redis to hold cached data):
1
2
3
4
5
6
> docker ps

CONTAINER ID       IMAGE              COMMAND                  CREATED             STATUS                PORTS                    NAMES
dca6c22fa844 superset_superset "/entrypoint.sh" 6 days ago Up 4 days (healthy) 0.0.0.0:8088->8088/tcp superset_superset_1
f22e0ca50545 postgres:10 "docker-entrypoint.s…" 6 days ago Up 4 days 0.0.0.0:5432->5432/tcp superset_postgres_1
5ec0565adb58 redis:3.2 "docker-entrypoint.s…" 6 days ago Up 4 days 0.0.0.0:6379->6379/tcp superset_redis_1
In a browser, I went to http://localhost:8088 and saw this after logging in:
The Use Case - Marc Lore's "Big 5" start up metrics
I personally get much more out of learning or demo'ing some new tech when I can use it to find a solution to one of my (or my friend's or employer's) real life problems. So I wanted to build a dashboard in Superset that would help one of my personal projects.
Marc Lore has founded some B2C companies that have had successful exits (thepit.com, diapers.com, jet.com) and is now running commerce for Walmart. I follow him on LinkedIn and saw his post this week:
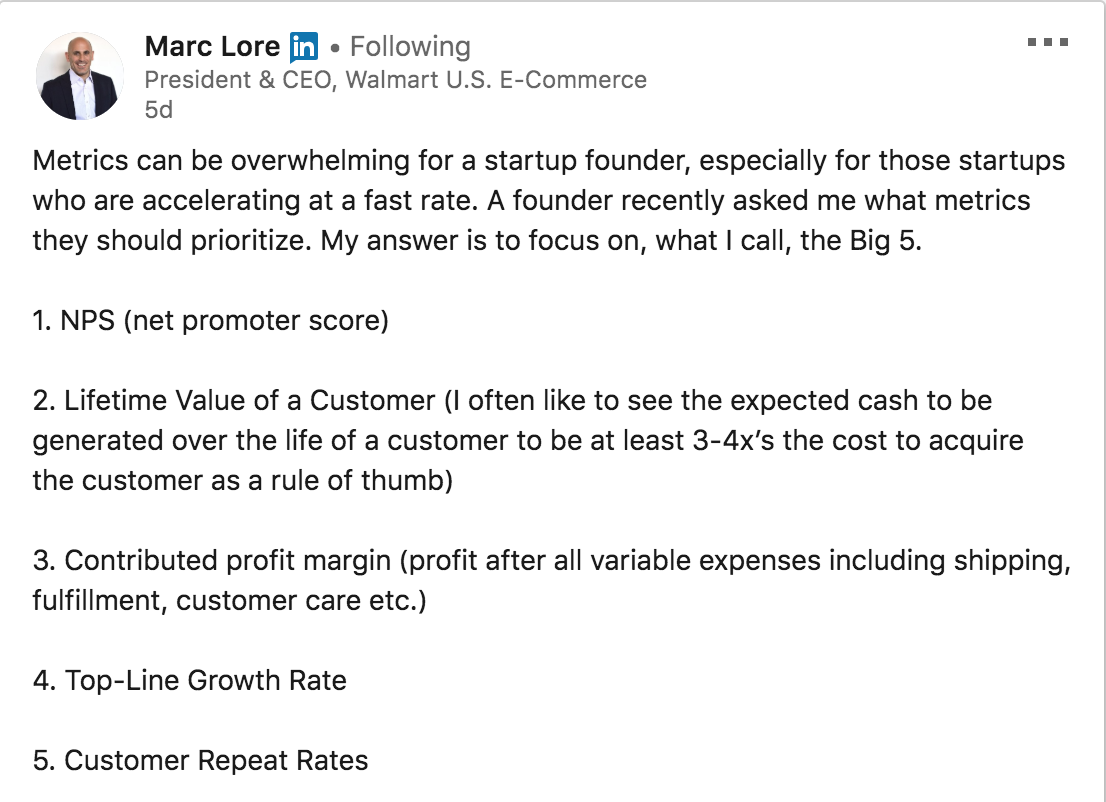
So I decided I would use Superset to show these metrics for my friend's company that I will not disclose the name (over 2 years old, profitable, growing, completely bootstrapped).
In this blog entry, I will walk you through the ease of use of Superset's functionality by connecting to a datasource and building a visualization for the first item on Marc's list - tracking NPS.
Setting up the data
The first thing you need to do is set up connections to our data sources. Superset uses the SQLAlchemy python library for interfacing with database. If you are using a database other than sqlite, you may need to install the correct python library so that SQLAlchemy can reach your database as shown at https://superset.incubator.apache.org/installation.html#database-dependencies.
I ran the following to install the mysql library on the docker running superset (calling the container_id from the docker ps command earlier:
1
2
docker exec -it dca6c22fa844 bash
pip install pymssql --user
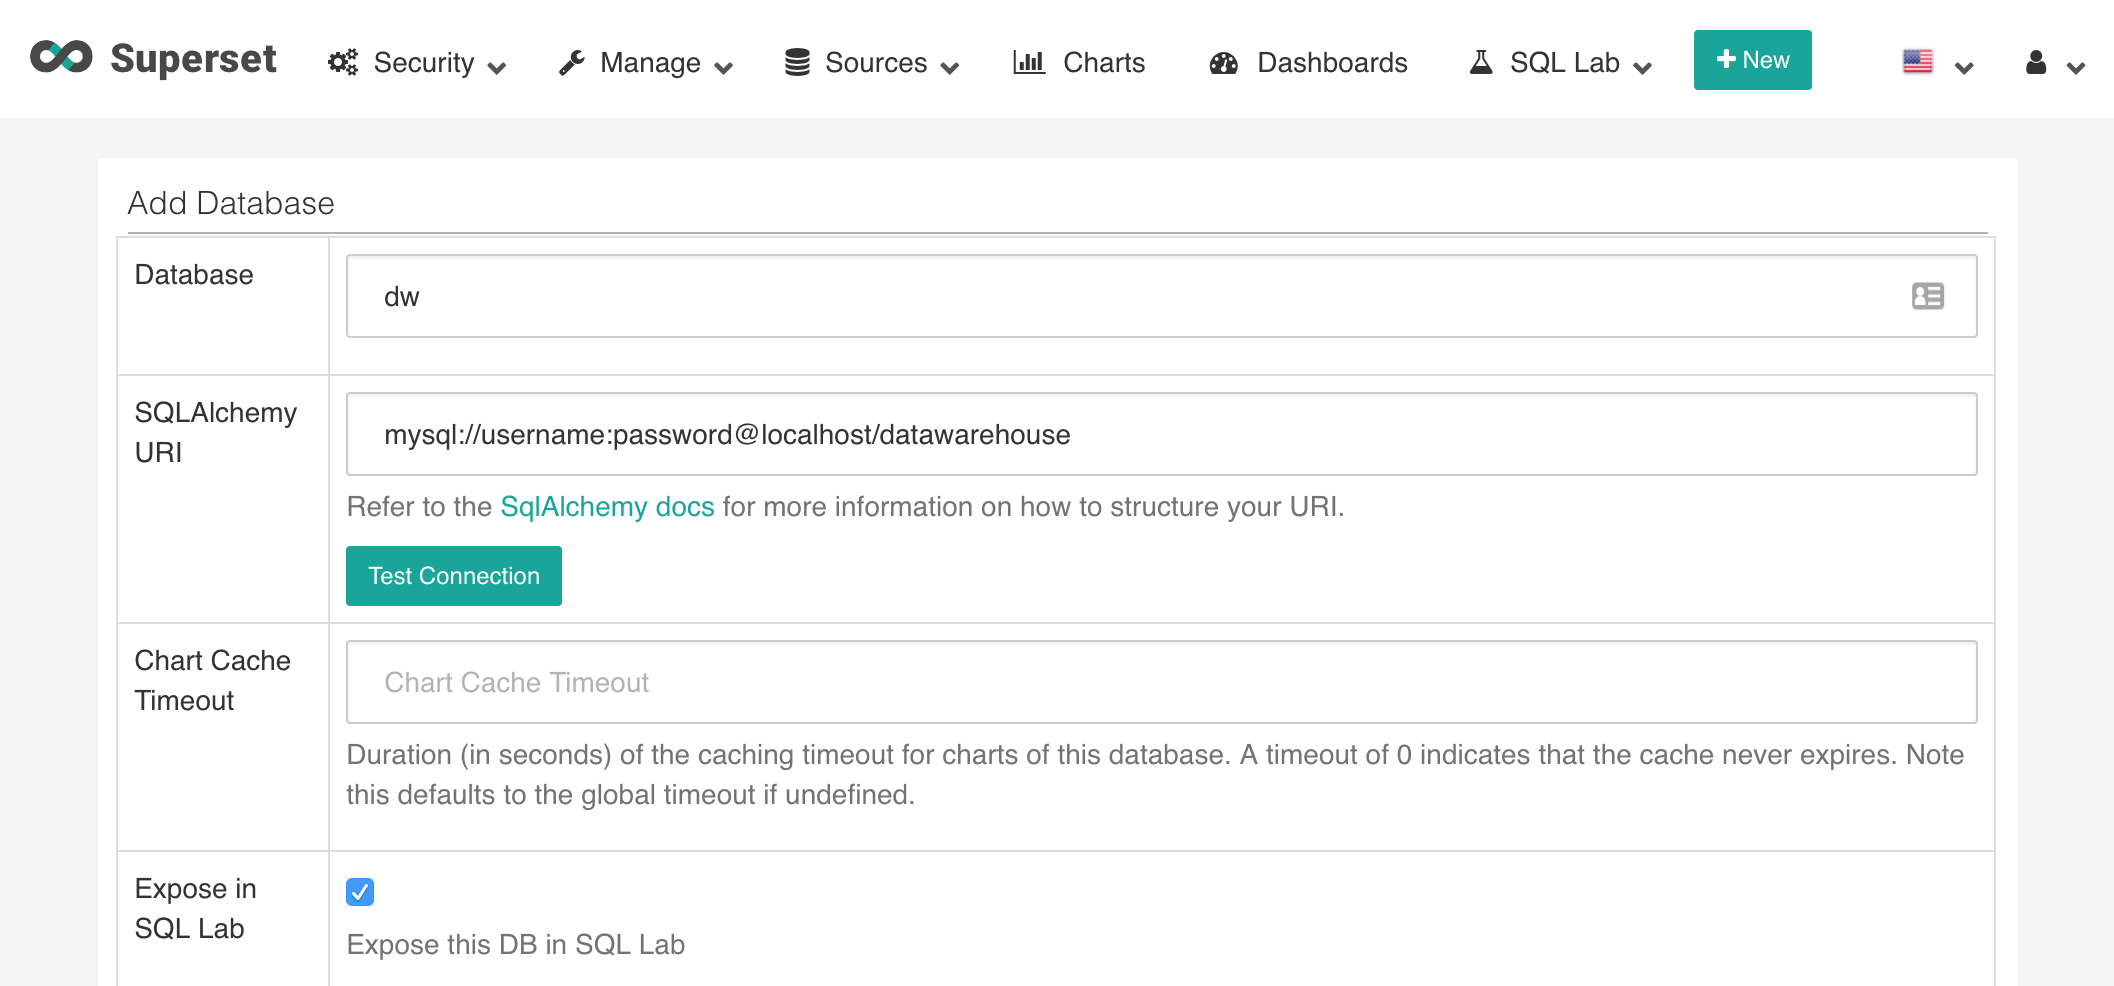
In the top menu I went to SOURCES > DATABASES. I set up a Database entry called "dw" that connected to mysql database:
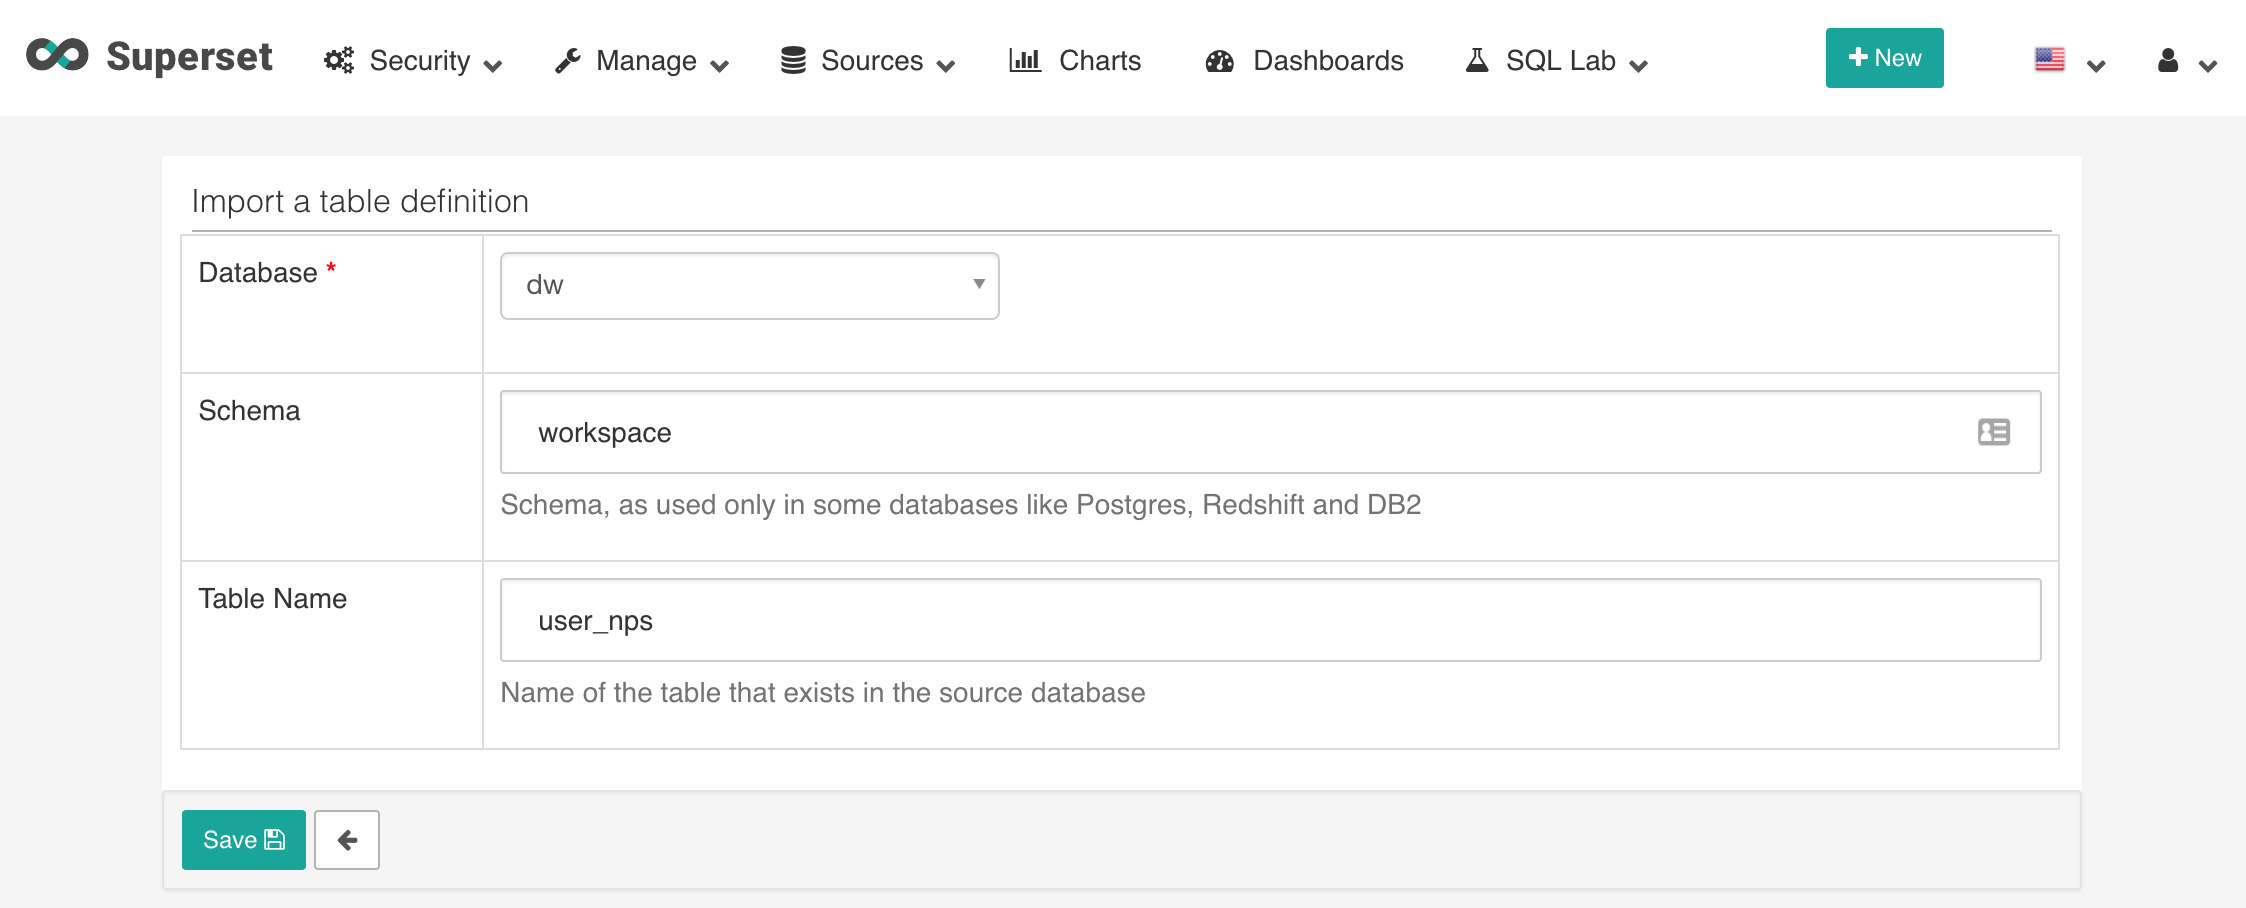
Superset allows us to then set up Tables that point at either a single table or view in whatever Database entries you create. You navigate to this by choosing the SOURCES > TABLES from the top menu. Then I set up a table using the "dw" database pointing at a view in mysql called user_nps:
Superset will look in the database to define the columns - default names, types, and if we treat them as dimensions can be overridden. The user_nps table in our mysql database contained 3 fields:
| Field | Type | Description |
| survey_date | timestamp | the date time of the survey |
| score | int | the score the user provided between 1 to 10 |
| uid | varchar | the user's unique identifier |
I needed to understand categorize each user score as either a promoter, detractor, or passive in order to calculate an NPS score, as defined in https://customergauge.com/blog/how-to-calculate-the-net-promoter-score/. I could just show the calculated score per month, but I would prefer to show the breakdowns to get a better sense of the distributions of what my users think of this service.
A Table in Superset allows me to create calculated fields (much like you could do in a sql view). In the table below, I have created 3 additional calculated fields:
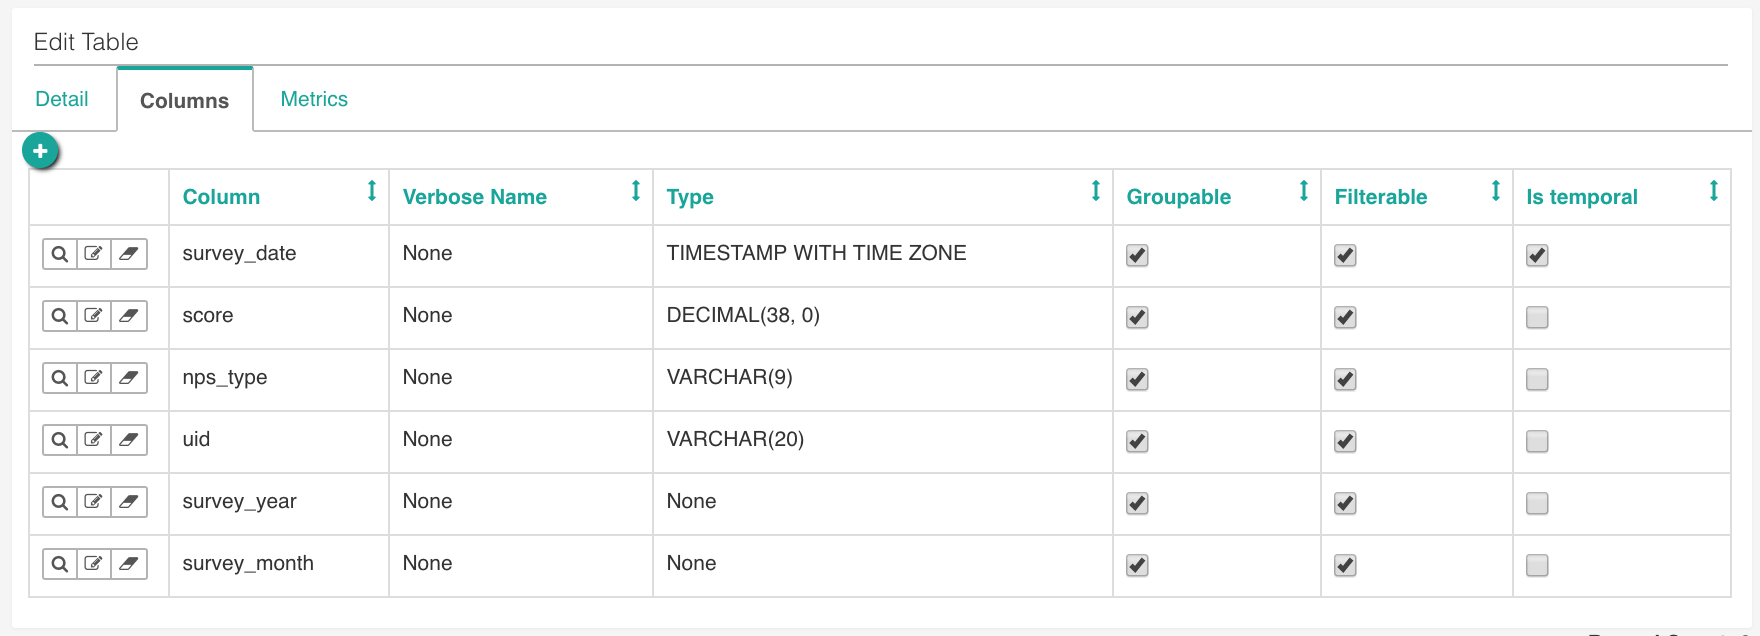
Here is the logic I used for the 3 calculated fields:
survey_year = YEAR(survey_date)
survey_month = MONTH(survey_date)
nps_type = CASE
    WHEN  score<7 THEN 'detractor'
    WHEN  score>8 THEN 'promoter'
    ELSE 'passive'
 END
Building Visualizations
In Superset, you can make Charts and you can insert those charts into Dashboards.
Once I have a Table created, making a chart is somewhat straight forward. I did the following:
- Clicked on the NEW button in top menu option and chose the "Chart" option.
- I chose the table I was interested in using - workspace.user_nps.
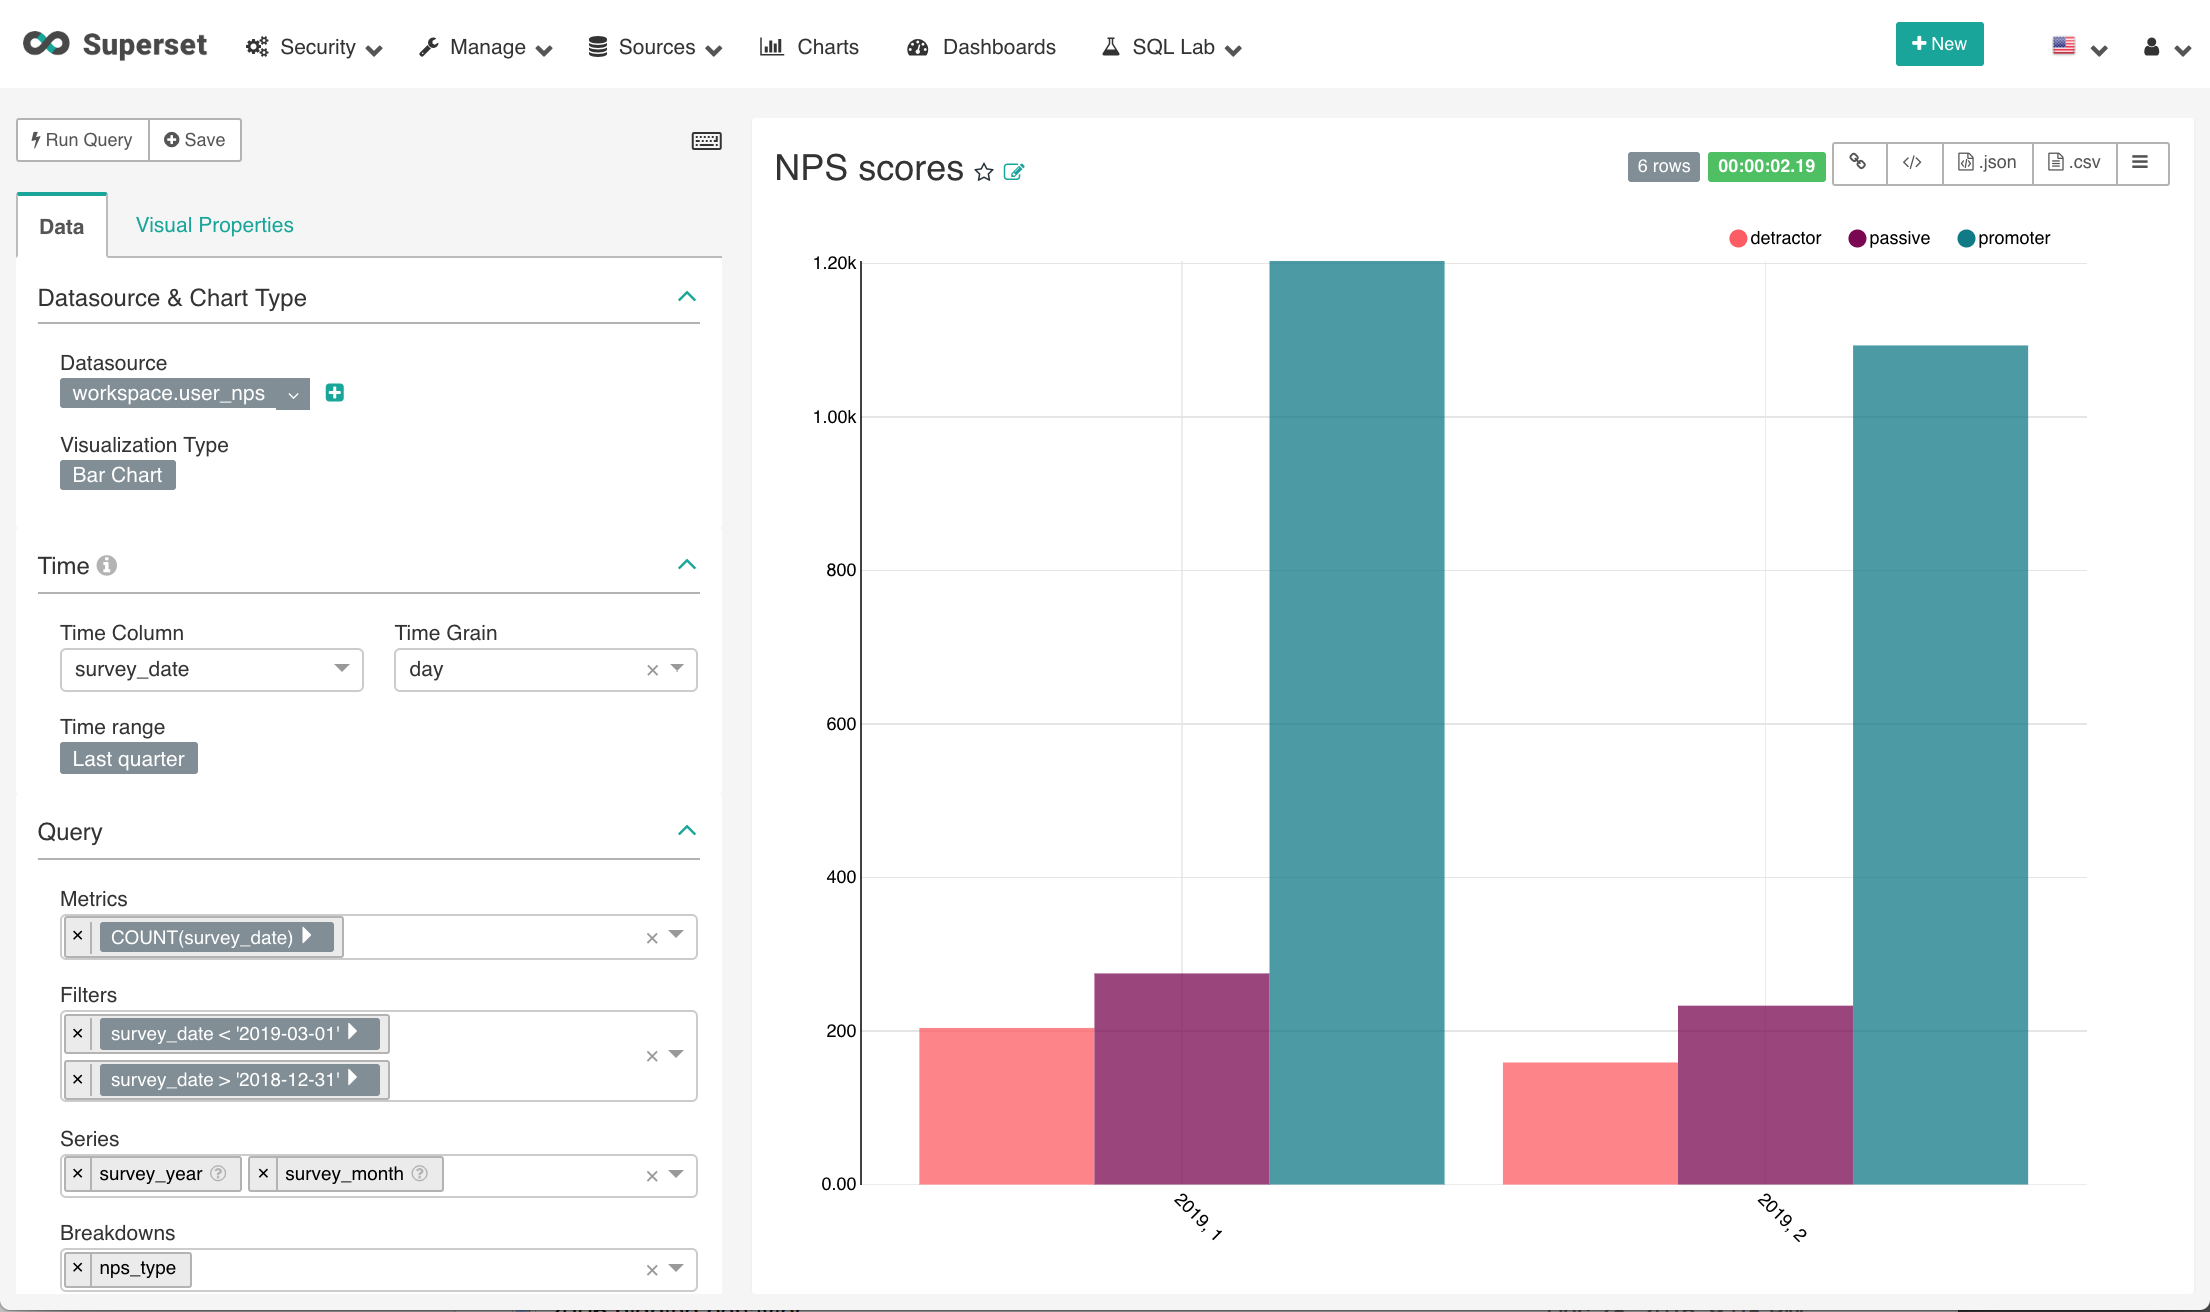
- I was taken to the screen shown below and I filled out the options on the left menu:
- Superset provides many types of visualization options, so I choose Bar Chart.
- I provided the date range I wanted my chart to consider.
- I chose the metrics, filter criteria, X-axis (Series +Breakdowns) and Y-axis (Metrics) - I hit the "Run Query" button to visualize it and the "Save" button to save the chart for future use.
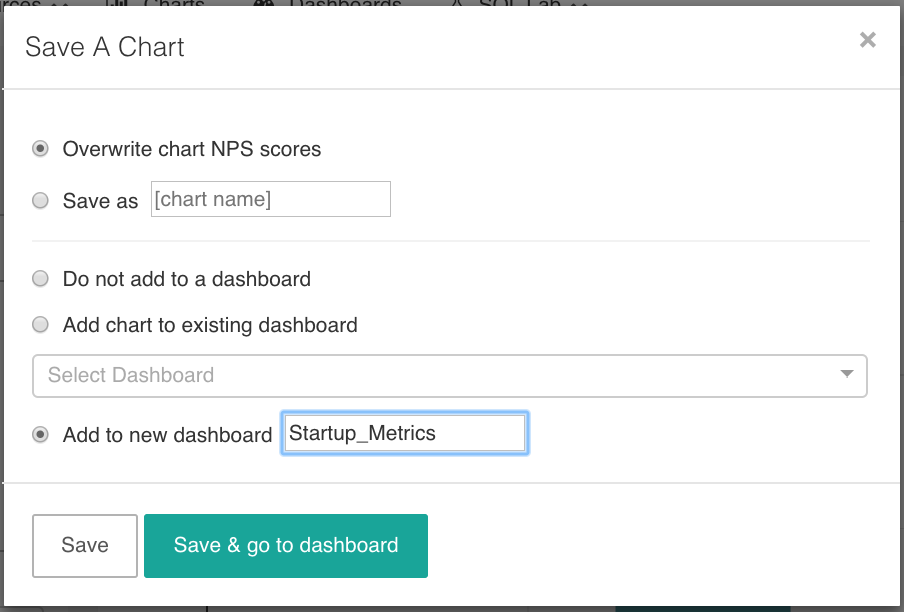
As part of the command to save the Chart (show below), it provided the option to create a new Dashboard I called "Startup_Metrics":
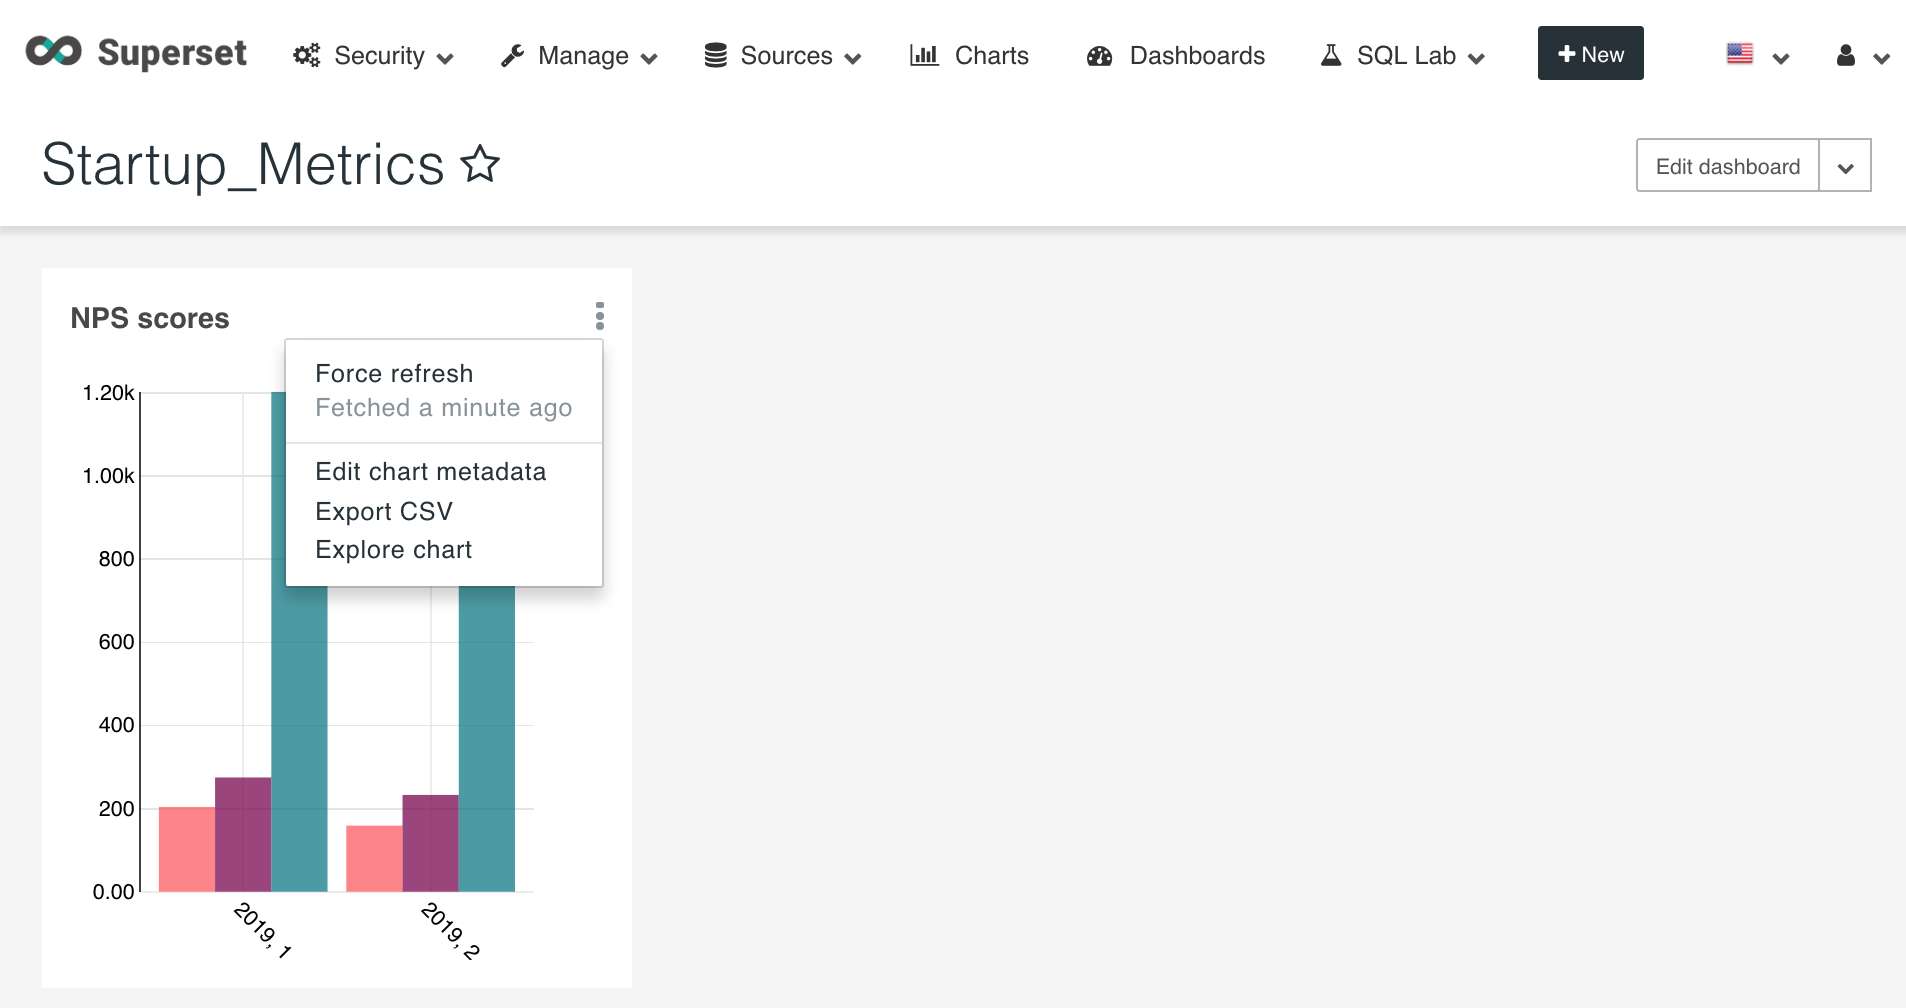
From the DASHBOARD top menu item, I can view any of the dashboards I have created. Below is a screenshot of the Startup_Metrics dashboard:
There are many features for Dashboards. I can:
- Control the layout of the dashboard. I can add columns / rows / tabs, resize charts, and can even add markdown.
- Limit who may access or edit it (based on their roles).
- Set a cache limit to determine how often the data is to be refreshed from the source database.
- Create a permalink to send or email it to people.
- Explore any chart (click on the the 3 stacked dots on the upper right corner), allowing folks with permissions to view how it was created and make their own version.
Limitations
- Since it leverages SQLAlchemy, there is a limitation that it does not provide the capability to join data across tables. This means that you must create a view with all the data elements needed for the Charts you want to build.
- Superset supports pretty simple aggregation, the complex and mulit-level groupings and calculations are probably better down as a view in a source system
- If you try to return more than a few thousand results to the browser, the performance becomes pretty slow.
- Superset does not have the ability to subscribe to a Chart or Dashboard so it would be emailed to a user on a specified interval, an important feature in most of the commercial dashboard solutions.
Conclusions
This doesn't have all the bells and whistles of Looker or Tableau. If you have a big enterprise that you want to launch self service reporting for hundreds of non-technical folks, this is probably not the best fit. The limitations above are things that would cause pain when a company scales to many simultaneous users.
However, there are pros I love about it:
- Superset is free! It can provide a nice start for smaller companies and personal projects.
- The pre-canned docker-compose git project makes set up super easy. I was surprised how well it ran on my laptop.
- The learning curve was low, I hooked up to my database and built my first dashboard with 5 charts in under 2 hours.
- This thing has had different names, but it is over 3 years old and has went through lots of nice iteration.
- It's written in Python, which a large audience of data folks enjoy using. Since it is open source, we can fork and extend it as we please.
